Thinking Fast & Slow in Purchasing

In this article, our own Tal Kotler evaluates the signficant impact of fast and slow thinking on procurement.

Purchasing teams are responsible for making critical decisions related to buying goods and services for an organization. These decisions can have a significant impact on the success of the business, both in the short and long term. However, purchasing teams are at a disadvantage because they can fall prey to the cognitive biases associated with the way humans think, known as fast and slow thinking.

Inking a Better Printer Ink Deal

In this article, the author takes a closer look at what constitutes printer ink, where it’s sourced, how much it actually costs to produce, and the profit margins of the vendors.

In addition, the author provides valuable insight into ways to ensure that your business is getting the best price possible for that valuable, yet often overlooked, company resource.

Medical Middlemen & A Broken Procurement System

Broken system making it harder for hospitals and patients to get some life-saving drugs

On “60 Minutes” this week, former heads of a generic drug company and Vizient, a Group Purchasing Organization (GPO), discussed how the healthcare purchasing system involving GPOs is too complicated and too broken. As one of them stated, the system is designed purposefully for a lack of transparency and to create confusion around pricing.

How to Leverage Loss Aversion & Prospect Theory for Pricing Negotiation

In this article, the author explains the psychological phenomenon of “loss aversion” and how it can be applied in pricing strategy. 

Raymond Augustin is a recognized thought leader specializing in pricing strategy. He has, as the COO of Virtual Procurement Services (VPS), provided guidance to dozens of healthcare organizations and tribal gaming operations on purchase price methodology and analytics.

The Truth About SaaS Pricing

The current drive to SaaS (Software as a Service), or better known as subscription, and away from typical on-premise solutions is not a totally new phenomenon.  What is new is how many traditional software organizations are moving to replace their existing sales models with a subscription offering.  There is some truth to the ‘follow the herd’ mentality of software vendors, as there is greater protection in number from the regulatory bodies and political opportunists, but without a doubt there is a fundamental financial benefit to the publishers of subscription software.

From the purchaser’s perspective the financial calculations seem straight forward:


Capital Costs

Software Maintenance

Services

Total

Year 1

$835,000.00

$150,300.00

$115,000.00

$1,100,300.00

Year 2


$150,300.00


Year 3


$150,300.00


Total

$835,000.00

$450,900.00

$115,000.00

$1,400,900.00

TABLE 1 – Typical Capital purchase and 3-year support agreement


 Capital Costs

Software Maintenance

Services

Total

Year 1


$321,475.00

$115,000.00

$436,475.00

Year 2


$321,475.00


Year 3


$321,475.00


Total

$0.00

$964,425.00

$115,000.00

$1,079,425.00

TABLE 2 – Same product structured as 3-year subscription agreement


In Table 1 above, the final negotiated price presented as a capital purchase with the normal support and maintenance agreement which would include the required service level agreement for support calls and access to updates and patches, and may include limitations on how many generations back it will support etc.  Table 2 is the same transaction but presented as a hosted subscription.  For sake of simplicity, inflation is assumed to be negligible in all cases.  Comparing the above transaction, it does appear that the total cost is less on the subscription front: ($1.07M vs $1.4M).

Let us look at this over a 5-year horizon:


Capital Costs

Software Maintenance

Services

Total

Year 1

$835,000.00

$150,300.00

$115,000.00

$1,100,300.00

Year 2


$150,300.00


Year 3


$150,300.00


Year 4


$150,300.00


Year 5


$150,300.00


Total

$835,000.00

$751,500.00

$115,000.00

$1,701,500.00

TABLE 3 – Typical Perpetual License over 5 years


 Capital Costs

Software Maintenance

Services

Total

Year 1


$321,475.00

$115,000.00

$436,475.00

Year 2


$321,475.00


Year 3


$321,475.00


Year 4


$321,475.00


Year 5


$321,475.00


Total


$1,607,375.00

$115,000.00

$1,722,375.00

TABLE 4 – Similar purchase structured as subscription over 5 years


To make it more illustrative:

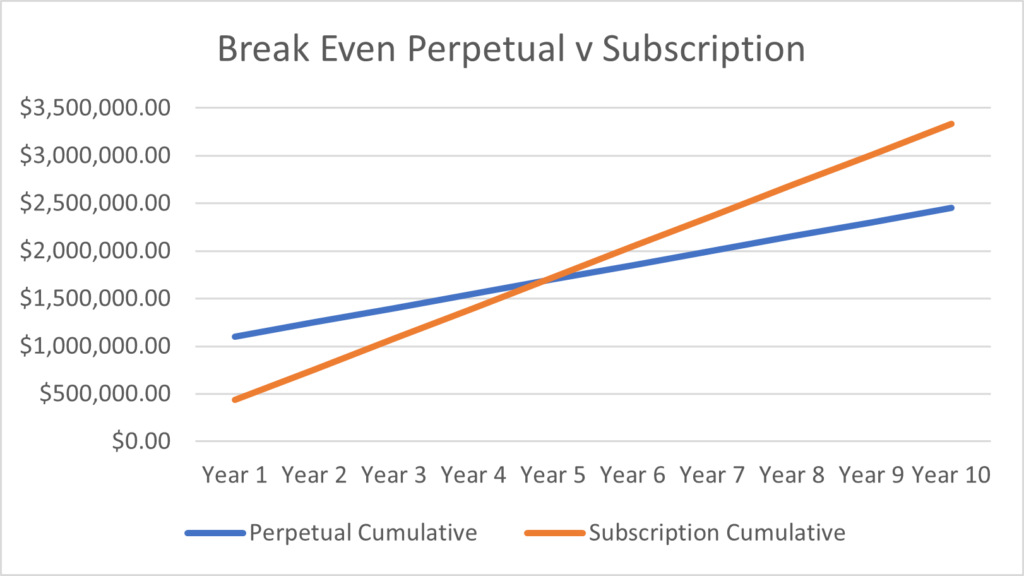
FIGURE 1 – Break Even Analysis TCO Perpetual vs Subscription

There is clearly a higher long-term cost to the subscription option ($1.72M vs $1.70M), even when incorporating the cost of any hardware or virtual machine and their associated operating costs. However, there is more than just a motivation for top line growth for the selling organization.

Let us look at an abbreviated P&L.  We already know that we should really be looking at comparing this over 5 years:


Year 5

Year 4

Year 3

Year 2

Year 1

On-prem


REVENUE


   Product


$835,000.00

   Services

$150,300.00

$150,300.00

$150,300.00

$150,300.00

$265,300.00

       Total Revenue

$150,300.00

$150,300.00

$150,300.00

$150,300.00

$1,100,300.00

COST OF SALES


  Product


$375,750.00

  Services*

$82,665.00

$82,665.00

$82,665.00

$82,665.00

$172,445.00

       Total cost of sales

$82,665.00

$82,665.00

$82,665.00

$82,665.00

$548,195.00


GROSS MARGIN

$67,635.00

$67,635.00

$67,635.00

$67,635.00

$552,105.00

Total


$822,645.00

*Assumes ABC allocation based on typical margin requirements.


TABLE 5 – Five-year abbreviated P&L for on-prem Sale


Year 5

Year 4

Year 3

Year 2

Year 1

SaaS


REVENUE


   Product


   Services

$317,300.00

$317,300.00

$317,300.00

$317,300.00

$492,420.00

       Total Revenue

$317,300.00

$317,300.00

$317,300.00

$317,300.00

$492,420.00

COST OF SALES


  Product


  Services*

$95,190.00

$95,190.00

$95,190.00

$95,190.00

$270,831.00

       Total cost of sales

$95,190.00

$95,190.00

$95,190.00

$95,190.00

$270,831.00


GROSS MARGIN

$222,110.00

$222,110.00

$222,110.00

$222,110.00

$221,589.00

Total


$1,110,029.00

TABLE 6 – Five-year abbreviated P&L for SaaS

As you can see above, the SaaS model is now more than 30% more profitable.

So far, we have been looking at just the sale to one customer.  The real profit accelerator for the SaaS companies comes with the scaling up of their customer base.  Again, comparing the On-prem for 5 years but this time let us assume 10 customers.  Along those lines the On-prem would have direct additive effect in the best case.  

However, 10 customers may have 10 different environments, different hardware, different OS versions, different virtual environments etc., and even different releases of the software solution.  In keeping with Service Level Agreements, the vendor will have to be able to support all these deployments and more than likely must have sandboxes that either replicate or emulate these environments to be able to test releases as well as troubleshoot problems.  It will need more staff at development, QA test and customer support level.


Year 5

Year 4

Year 3

Year 2

Year 1

On-prem


REVENUE


   Product


$8,350,000.00

   Services

$1,503,000.00

$1,503,000.00

$1,503,000.00

$1,503,000.00

$2,653,000.00

       Total Revenue

$1,503,000.00

$1,503,000.00

$1,503,000.00

$1,503,000.00

$11,003,000.00

COST OF SALES


  Product


$3,757,500.00

  Services

$601,200.00

$601,200.00

$601,200.00

$601,200.00

$1,299,970.00

       Total cost of sales

$601,200.00

$601,200.00

$601,200.00

$601,200.00

$5,057,470.00


GROSS MARGIN

$901,800.00

$901,800.00

$901,800.00

$901,800.00

$5,945,530.00

Total


$9,552,730.00

TABLE 7 On-prem abbreviated P&L assuming 10 customers

The table above assumes no increase in the costs of services (support) over the years, though that will normally grow for reasons expounded above.  


Year 5

Year 4

Year 3

Year 2

Year 1

SaaS


REVENUE


   Product


   Services

$3,173,000.00

$3,173,000.00

$3,173,000.00

$3,173,000.00

$4,924,200.00

       Total Revenue

$3,173,000.00

$3,173,000.00

$3,173,000.00

$3,173,000.00

$4,924,200.00

COST OF SALES


  Product


  Services

$475,950.00

$475,950.00

$475,950.00

$475,950.00

$1,428,018.00

       Total cost of sales

$475,950.00

$475,950.00

$475,950.00

$475,950.00

$1,428,018.00


GROSS MARGIN

$2,697,050.00

$2,697,050.00

$2,697,050.00

$2,697,050.00

$3,496,182.00

Total


$14,284,382.00

TABLE 8 – 10-year SaaS abbreviated P&L

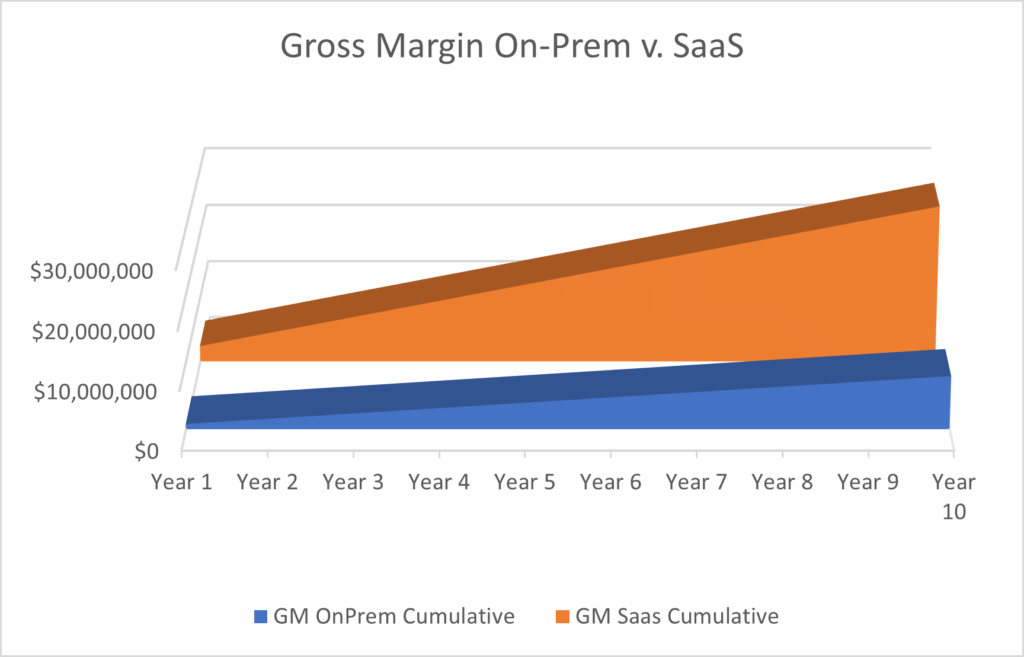
What you can see now is that the Gross Margin is now 50% higher than when selling an on-prem solution.

FIGURE 2 – Cumulative gross margin comparison on-prem vs. SaaS with 10 customers over 10 years

In conclusion the recommendation when converting or comparing an on-premise versus hosted subscription license is to look at 5-7 years for effective comparison purpose. When assessing a new SaaS solution, keep in mind that if the vendor has a mixed customer environment (some customers with on-prem and some with Subscription) that the margin is higher in the latter and the salesperson will be better compensated on the latter as well. And finally, when looking at pure subscription licenses, the larger the customer base the greater the margin the vendor has. 

50 Shades of Pricing

In the final part of this 3-part series, pricing and procurement expert Raymond Augustin demonstrates how stated price has tipped the scale towards sellers, creating an urgent need to return to a more symmetrical relationship between buyer and seller.

When the world was less standardized and more of an open market (say before 1861 when John Wanamaker introduced the price tag in Philadelphia), it was the norm for tradespeople to await the buyer’s first offer and then negotiate up. However, the subsequent swing towards an almost unified approach to stated price shifted negotiation power considerably over to the seller.

Should we be seeking a more balanced approach?

Author Raymond Augustin is a recognized thought leader, specializing in pricing strategy. He has an active interest in the research of the psychology of price and pricing motivations.

Scientia Potentia Est

In part 2 of a 3-part series, pricing and procurement expert Raymond Augustin presents several methods for mapping and analyzing key processes, market factors and data points in order to make more informed pricing decisions.

“Back in 1597 Sir Francis Bacon opined that knowledge itself is power. And with the correct data, analytics, and a framework of key processes, it’s possible to leverage the knowledge of what a market competitive price should be to avoid overspending.”

Author Raymond Augustin is a recognized thought leader, specializing in pricing strategy. He has an active interest in the research of the psychology of price and pricing motivations.

Oracle & SAP waging a secret war against third-party support

“SHOCKING FACT: The average Oracle/SAP customer pays around 22 per cent of their initial licensing price in maintenance fees annually, and 90 per cent of this fee is profit for Oracle/SAP….  That is why both Oracle and SAP are nervous about something called third-party support, a business model that replaces their official vendor support for only half the price – effectively cutting away the most profitable and stable revenue generator for both Oracle and SAP.”

This article found within “IT Pro Portal” (www.itproportal.com) highlights the benefits of using third-party support and why it is an alternative that large, formidable vendors are trying desperately to eliminate.

Check out how they are doing this and why you should still consider third-party support here in the full article.