


The current drive to SaaS (Software as a Service), or better known as subscription, and away from typical on-premise solutions is not a totally new phenomenon. What is new is how many traditional software organizations are moving to replace their existing sales models with a subscription offering. There is some truth to the ‘follow the herd’ mentality of software vendors, as there is greater protection in number from the regulatory bodies and political opportunists, but without a doubt there is a fundamental financial benefit to the publishers of subscription software.
From the purchaser’s perspective the financial calculations seem straight forward:
| Capital Costs | Software Maintenance | Services | Total |
Year 1 | $835,000.00 | $150,300.00 | $115,000.00 | $1,100,300.00 |
Year 2 | $150,300.00 | |||
Year 3 | $150,300.00 | |||
Total | $835,000.00 | $450,900.00 | $115,000.00 | $1,400,900.00 |
TABLE 1 – Typical Capital purchase and 3-year support agreement
Capital Costs | Software Maintenance | Services | Total | |
Year 1 |
| $321,475.00 | $115,000.00 | $436,475.00 |
Year 2 | $321,475.00 | |||
Year 3 | $321,475.00 | |||
Total | $0.00 | $964,425.00 | $115,000.00 | $1,079,425.00 |
TABLE 2 – Same product structured as 3-year subscription agreement
In Table 1 above, the final negotiated price presented as a capital purchase with the normal support and maintenance agreement which would include the required service level agreement for support calls and access to updates and patches, and may include limitations on how many generations back it will support etc. Table 2 is the same transaction but presented as a hosted subscription. For sake of simplicity, inflation is assumed to be negligible in all cases. Comparing the above transaction, it does appear that the total cost is less on the subscription front: ($1.07M vs $1.4M).
Let us look at this over a 5-year horizon:
Capital Costs | Software Maintenance | Services | Total | |
Year 1 | $835,000.00 | $150,300.00 | $115,000.00 | $1,100,300.00 |
Year 2 | $150,300.00 | |||
Year 3 | $150,300.00 | |||
Year 4 | $150,300.00 | |||
Year 5 | $150,300.00 | |||
Total | $835,000.00 | $751,500.00 | $115,000.00 | $1,701,500.00 |
TABLE 3 – Typical Perpetual License over 5 years
Capital Costs | Software Maintenance | Services | Total | |
Year 1 |
| $321,475.00 | $115,000.00 | $436,475.00 |
Year 2 | $321,475.00 | |||
Year 3 | $321,475.00 | |||
Year 4 | $321,475.00 | |||
Year 5 | $321,475.00 | |||
Total |
| $1,607,375.00 | $115,000.00 | $1,722,375.00 |
TABLE 4 – Similar purchase structured as subscription over 5 years
To make it more illustrative:
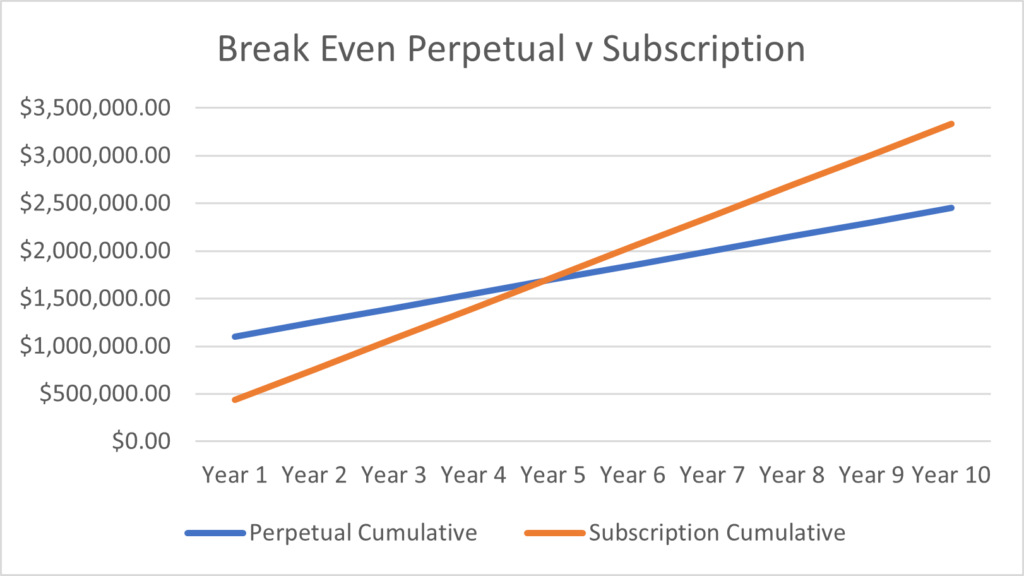
FIGURE 1 – Break Even Analysis TCO Perpetual vs Subscription
There is clearly a higher long-term cost to the subscription option ($1.72M vs $1.70M), even when incorporating the cost of any hardware or virtual machine and their associated operating costs. However, there is more than just a motivation for top line growth for the selling organization.
Let us look at an abbreviated P&L. We already know that we should really be looking at comparing this over 5 years:
Year 5 | Year 4 | Year 3 | Year 2 | Year 1 | |
On-prem | |||||
REVENUE | |||||
Product | $835,000.00 | ||||
Services | $150,300.00 | $150,300.00 | $150,300.00 | $150,300.00 | $265,300.00 |
Total Revenue | $150,300.00 | $150,300.00 | $150,300.00 | $150,300.00 | $1,100,300.00 |
COST OF SALES | |||||
Product | $375,750.00 | ||||
Services* | $82,665.00 | $82,665.00 | $82,665.00 | $82,665.00 | $172,445.00 |
Total cost of sales | $82,665.00 | $82,665.00 | $82,665.00 | $82,665.00 | $548,195.00 |
GROSS MARGIN | $67,635.00 | $67,635.00 | $67,635.00 | $67,635.00 | $552,105.00 |
Total | $822,645.00 | ||||
*Assumes ABC allocation based on typical margin requirements.
|
|
| |||
TABLE 5 – Five-year abbreviated P&L for on-prem Sale
Year 5 | Year 4 | Year 3 | Year 2 | Year 1 | |
SaaS | |||||
REVENUE | |||||
Product |
| ||||
Services | $317,300.00 | $317,300.00 | $317,300.00 | $317,300.00 | $492,420.00 |
Total Revenue | $317,300.00 | $317,300.00 | $317,300.00 | $317,300.00 | $492,420.00 |
COST OF SALES | |||||
Product | |||||
Services* | $95,190.00 | $95,190.00 | $95,190.00 | $95,190.00 | $270,831.00 |
Total cost of sales | $95,190.00 | $95,190.00 | $95,190.00 | $95,190.00 | $270,831.00 |
GROSS MARGIN | $222,110.00 | $222,110.00 | $222,110.00 | $222,110.00 | $221,589.00 |
Total | $1,110,029.00 |
TABLE 6 – Five-year abbreviated P&L for SaaS
As you can see above, the SaaS model is now more than 30% more profitable.
So far, we have been looking at just the sale to one customer. The real profit accelerator for the SaaS companies comes with the scaling up of their customer base. Again, comparing the On-prem for 5 years but this time let us assume 10 customers. Along those lines the On-prem would have direct additive effect in the best case.
However, 10 customers may have 10 different environments, different hardware, different OS versions, different virtual environments etc., and even different releases of the software solution. In keeping with Service Level Agreements, the vendor will have to be able to support all these deployments and more than likely must have sandboxes that either replicate or emulate these environments to be able to test releases as well as troubleshoot problems. It will need more staff at development, QA test and customer support level.
Year 5 | Year 4 | Year 3 | Year 2 | Year 1 | |
On-prem | |||||
REVENUE | |||||
Product | $8,350,000.00 | ||||
Services | $1,503,000.00 | $1,503,000.00 | $1,503,000.00 | $1,503,000.00 | $2,653,000.00 |
Total Revenue | $1,503,000.00 | $1,503,000.00 | $1,503,000.00 | $1,503,000.00 | $11,003,000.00 |
COST OF SALES | |||||
Product | $3,757,500.00 | ||||
Services | $601,200.00 | $601,200.00 | $601,200.00 | $601,200.00 | $1,299,970.00 |
Total cost of sales | $601,200.00 | $601,200.00 | $601,200.00 | $601,200.00 | $5,057,470.00 |
GROSS MARGIN | $901,800.00 | $901,800.00 | $901,800.00 | $901,800.00 | $5,945,530.00 |
Total | $9,552,730.00 |
TABLE 7 – On-prem abbreviated P&L assuming 10 customers
The table above assumes no increase in the costs of services (support) over the years, though that will normally grow for reasons expounded above.
Year 5 | Year 4 | Year 3 | Year 2 | Year 1 | |
SaaS | |||||
REVENUE | |||||
Product |
| ||||
Services | $3,173,000.00 | $3,173,000.00 | $3,173,000.00 | $3,173,000.00 | $4,924,200.00 |
Total Revenue | $3,173,000.00 | $3,173,000.00 | $3,173,000.00 | $3,173,000.00 | $4,924,200.00 |
COST OF SALES | |||||
Product | |||||
Services | $475,950.00 | $475,950.00 | $475,950.00 | $475,950.00 | $1,428,018.00 |
Total cost of sales | $475,950.00 | $475,950.00 | $475,950.00 | $475,950.00 | $1,428,018.00 |
GROSS MARGIN | $2,697,050.00 | $2,697,050.00 | $2,697,050.00 | $2,697,050.00 | $3,496,182.00 |
Total | $14,284,382.00 |
TABLE 8 – 10-year SaaS abbreviated P&L
What you can see now is that the Gross Margin is now 50% higher than when selling an on-prem solution.
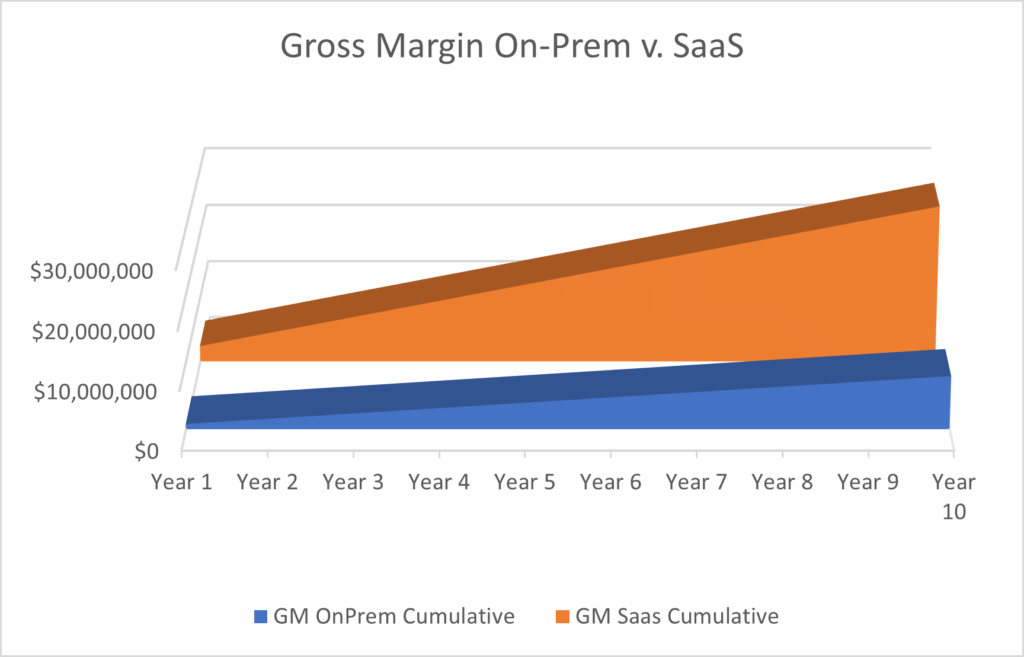
FIGURE 2 – Cumulative gross margin comparison on-prem vs. SaaS with 10 customers over 10 years
In conclusion the recommendation when converting or comparing an on-premise versus hosted subscription license is to look at 5-7 years for effective comparison purpose. When assessing a new SaaS solution, keep in mind that if the vendor has a mixed customer environment (some customers with on-prem and some with Subscription) that the margin is higher in the latter and the salesperson will be better compensated on the latter as well. And finally, when looking at pure subscription licenses, the larger the customer base the greater the margin the vendor has.